
BLOG
/
Product
Introducing Live Graph: query your entire stack in real time
Today we're shipping the feature the whole platform was built toward. Live Graph connects every tool you run into one continuously-updated, permission-aware model, and lets anyone on your team question it in plain language, with every answer sourced.

Priya Nair

Most software makes you go to the data. You pick a tool, remember its quirks, build a report, and copy the number somewhere else. Live Graph flips that around: the data comes to one place, stays current, and answers when you ask. No SQL, no dashboard backlog, no stale exports.
We've been quietly running Live Graph with design partners for six months. Starting today, it's available to every Growth and Enterprise team. Here's what it does and why it's different.
One model, always current
Behind every Live Graph is a single model of your company assembled from the tools you already use: CRM, warehouse, product analytics, support, billing, code. Instead of syncing on a schedule, it updates continuously as events happen, so the graph reflects reality to the second rather than to the morning.
Because it's one model, the hard joins are already done. "Show me enterprise accounts with declining usage and an open escalation" isn't three queries against three systems; it's one question against one graph.
You shouldn't have to know which tool owns the answer. You should just be able to ask the question.
Ask in plain language, and trust the answer
Type a question the way you'd say it out loud. Live Graph translates it into a query over the graph, runs it, and returns a synthesized answer with the receipts attached. Every figure links back to the exact records it came from, so you can verify in one click instead of taking it on faith.
Cited by default. No answer ships without its sources. Hover any number to see the underlying rows.
Permission-aware. The graph only traverses what you're allowed to see, so the same question safely returns different answers for different people.
Followable. Ask a follow-up and it keeps the context. Drill from a metric to the accounts behind it without starting over.
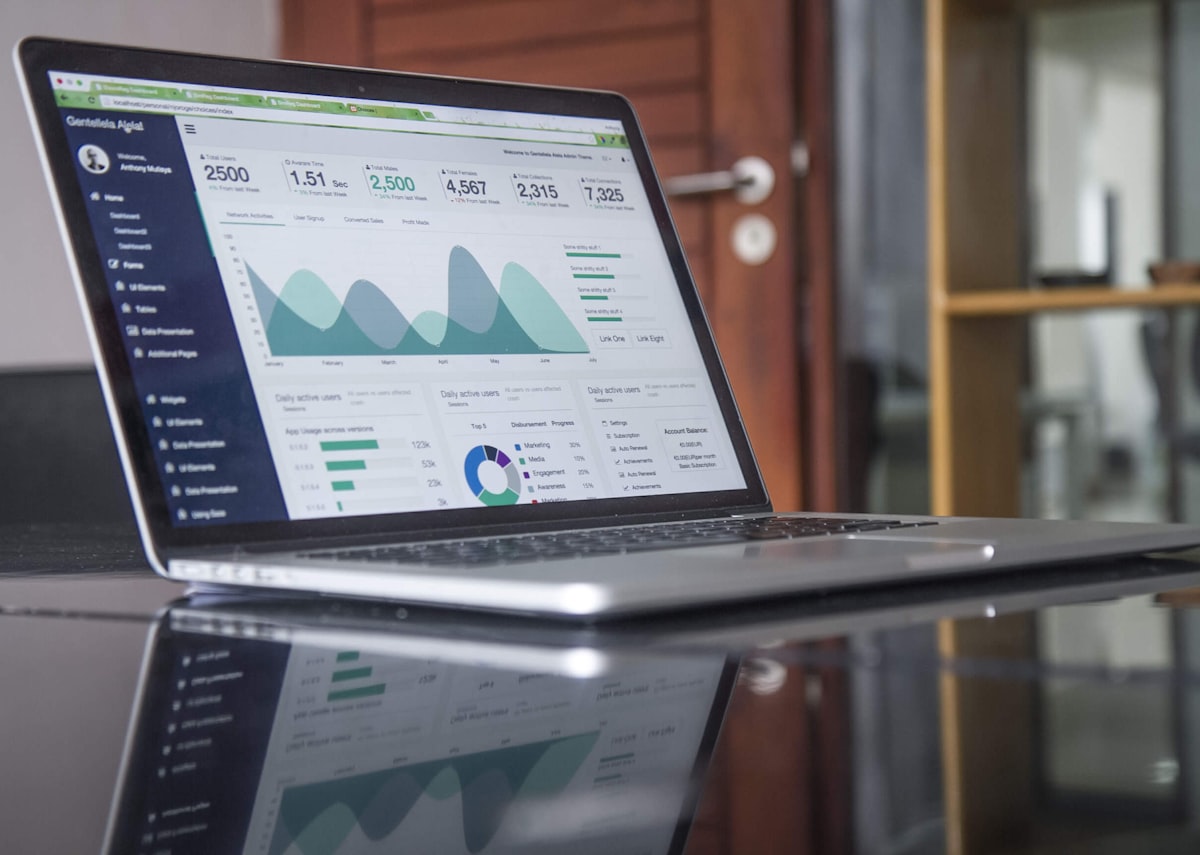
Every answer is a starting point, not a dead end. Keep asking until you understand.
From answer to action
Knowing something changed is only useful if you can do something about it. Live Graph connects to Workflows, so a question can become a trigger: when an account crosses a risk threshold, open a task, notify the owner, or kick off a playbook automatically, the moment the graph updates.
Try this on day one: save the question "which customers are at risk this week," then attach an alert. You've just replaced a recurring meeting with a system that watches for you.
What's next
Live Graph is the foundation, not the finish line. Over the next few releases we're adding scheduled briefings, deeper agent actions, and a graph API so you can build your own experiences on top. We can't wait to see what you ask it.
Keep reading

Customer Stories
Jun 2026
How Northwind cut reporting time by 70% with one question box
The ops team at Northwind used to spend Mondays assembling a status report no one fully trusted. Six dashboards and a wall of spreadsheets later, they replaced the whole ritual with a single question box, and got their week back.

Sofia Reyes
Product
Jun 2026
Introducing Live Graph: query your entire stack in real time
Today we're shipping the feature the whole platform was built toward. Live Graph connects every tool you run into one continuously-updated, permission-aware model, and lets anyone on your team question it in plain language, with every answer sourced.
Priya Nair

Engineering
Jun 2026
Why we rebuilt our query engine around a single live graph
For two years we shipped answers from nightly snapshots. They were fast, wrong by morning, and quietly eroding trust. Here's how we moved to one continuously-updated graph, and what it taught us about latency, freshness, and the cost of "good enough."

Marcus Hale
GET STARTED
Bring every system into focus.
See your whole company in one place. Spin up a guided pilot on your real data in under a week.
No credit card · 14-day pilot · SOC 2 Type II